Without recourse.
All Rights Reserved. Tree of Life©
Statement of belief: “Sanctify them
through thy truth: thy word is truth.”
(John 17:17 KJV)
Created
5942[v2016-12-14-21:32] 12 21 - 01 12 2039 [2023-03-14 thru
2023-04-19]
Created
5942[v2016-12-14-21:32] 12 21 - 09 13 2039 [2023-04-30] – As
excerpted from my Reformation file…
Further
work 5942[v2016-12-14-21:32] 01 24 2039 [2023-05-13 eve]
Update
5942[v2016-12-14-21:32] 01 25 2039 [2023-05-15] – Added figs. #103 & #119, and edited fig. #104.
Addition
5942[v2016-12-14-21:32] 02 04 2039 [2023-05-29] – Added a reference link to my 3D AutoCad page
Addition
5942[v2016-12-14-21:32] 03 04 2039 [2023-06-23] – Added a section re the
dating of the Sphinx and more.
.
Ice Ages vs the Very Recent Pole Shifts
Fig.
1: Tomb painting from c. 1700 BCE in Beni Hassan, Egypt, showing Israelite
immigrants. Notice the colorful dresses and their noses!
Fig.
2: The Ipuwer papyrus that describes the 10 plagues in Egypt.
Fig.
3: Grave stone on the island of Mycenae, Greece, depicting a scene from the
parting of the Red Sea.
Please
watch for 2 minutes beginning at this
link!
The
author of the above linked video makes a good case for a major eruption of Mt. Santorino, Greece being at the cause of the 10 plagues,
but
could it be that that eruption was also associated with a pole shift, or
perhaps as an adjustment prior to, or at the end of, a pole shift?
A Little Background History from
far beyond:
Many important, yet hidden, and
forgotten archeological discoveries from the grave mounds in Sweden are
reported in this book, printed in 1874:


Fig.
4 & 5: [English translation of book title: ‘Stories from the Swedish
History’ by C. Georg Starbäck; printed in the year 1874!]
The
Swedish book “Berättelser ur Swenska Historien”, af C. Georg Starbäck; Stockholm. F. & C. Beijers
förlag;
Printed
in Norrköping 1874 by M. W. Wallberg & Comp. Boktryckeri.
In the above book I read that -
based upon the finds within said grave mounds - around 700 BCE people
immigrated from the east into Scandinavia. These immigrating people (bringing
in the so called ‘Bronze Age’) were very tall in comparison to the Eskimo (the
so called ‘Stone Age’) people previously inhabiting the southern and western
coast lines of Scandinavia, at a time when most of Scandinavia was still
largely covered by glaciers. That is, the land ice of the so-called Ice Age -
as evidenced also by ancient Arabic maps of Scandinavia dated to c. 200 CE.
The culture, tools etc., of the
Eskimo people buried in said grave mounds are described as being identical to
those of the Eskimos on Greenland up until at least 1950. In contradistinction,
said immigrants from the east were skilled artisans in the making of tools,
weapons, and art using bronze craftmanship (cf. “the Bronze Age”). These
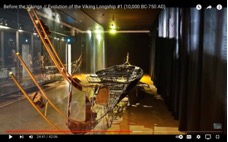
immigrants arrived traveling in Viking ships reminiscent
of the ships
buried next to the pyramids in Egypt. The Church boats being used in
Dalarna, Sweden are also very much of the same design and architecture. These
immigrants from the east came from the Black Sea through the river Volga and
more, at a time when said east was really north and towards the equator (sic!
More below…). Another source
reports that the traditional national dresses still being used in Sweden today
are very similar to those traditionally used within Israel. Indeed, there are
many characteristics indicating that Scandinavian people are descendants from
the ten tribes of Israel.
1:
Viking ship; 2: Ship at Giza, Egypt; 3: From the Hecht Museum in Haifa,
Israel; 4: A church boat on Lake Siljan at Rättvik, Dalarna, Sweden.
[Notice:
Click any photo within to see its source!]
“These
new ships carrying travelers from the east. They were different… had their
roots in Lebanon and Israel…”
“Evidence
of travelers from the Levant has been found all along the Mediterranean and
beyond…”
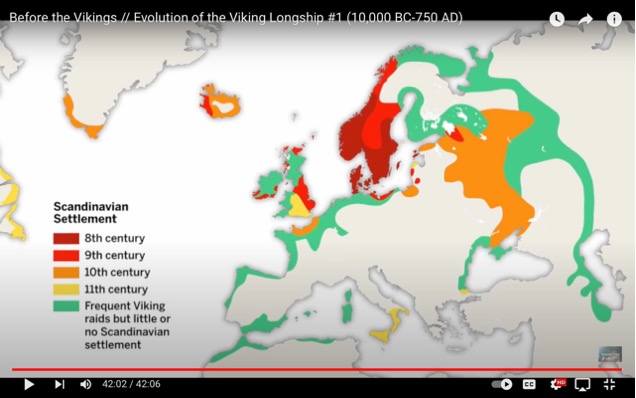
Notice
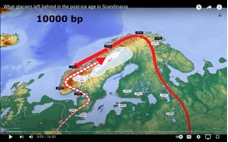
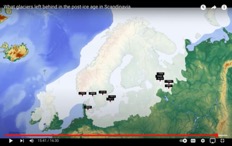
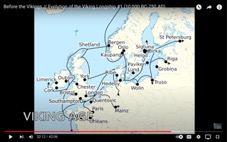
in particular the green areas of “Frequent Viking Raids” That is, documented
travel routes at the time!
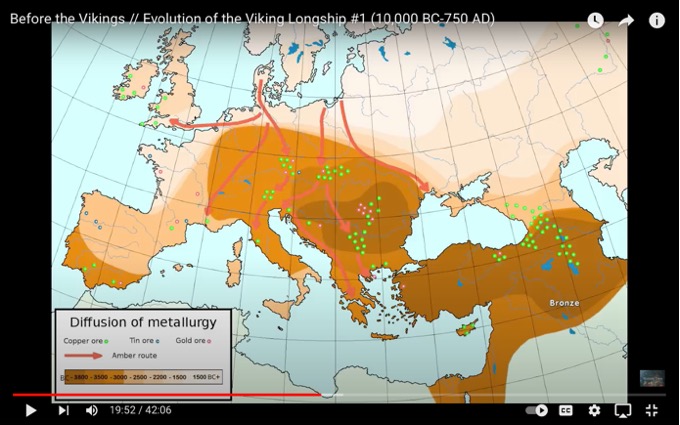
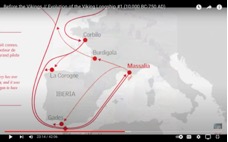
“Tin…
a rare metal… one of the main components of bronze making… Still mined… in Baratanac, the Land of Tin…”
Fig. 6 thru 46: ”As
early as 445 BC Herodotus speaks of the British Isles as the Tin Islands… The
Greek explorer Pytheas of Masilia, writer of the now lost earliest account of
the North Atlantic mentioned the tin trading… Polybius… Diodorus… as early as
1500 BC… The Phoenicians…” Tin mines of 1500 BC Iberia (Spain)... “The walled
Copper Age metropolis Los Millares c. 3200-2300 BC… Canaan writing [ancient
Hebrew]… There is no known
instance of a Phenician ever calling themselves a Phenician or any other
collective term… they describe themselves in terms of their individual
names and cities…[Notice the large
noses and the evidence of circumcision!]… Why did they call
themselves Phenicians?... They didn’t… It’s a Greek word… a dye… may have had
red hair… ? Their origin… Baalbek
Lebanon… immense size
[from the
time of Solomon’s building activities]… King Ahiram of Byblos… [2 Sam
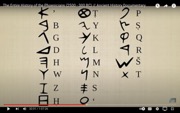
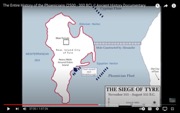
5:11; 1 King 5:1-12; 7:13-45; 9:11-27; 1 Chr 14:1; 2 Chr 4:11]… 22 letter alphabet… The Siege of Tyre…”
Important, But Forgotten – or Hidden -
Background
For Better Understanding
the Migrations of the 10 Tribes Taken Captives by the Assyrian King
Around 700 BCE. That is,
the Roots of Some of the Scandinavian People:
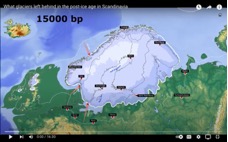
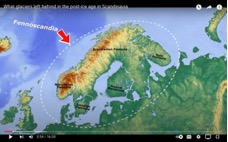
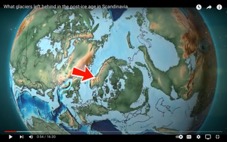
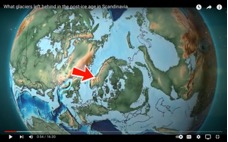
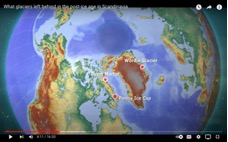
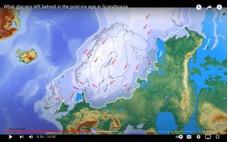
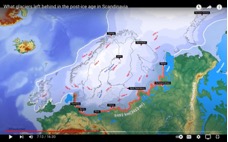
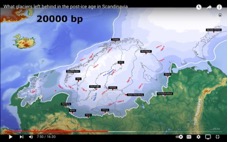
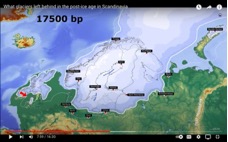
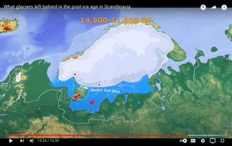
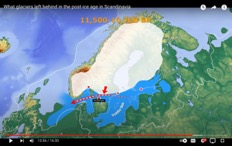
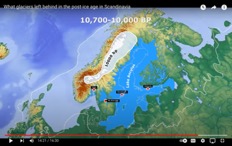
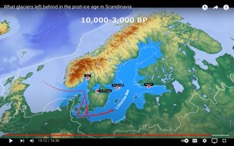
Fig. 47 thru 49: Until the pole
shift of around 1420 BCE the
North Pole was located about 100 km west of the Norwegian coast (just below
the ‘g’ in “Floating Ice” in the above map). After said pole shift of 1420 BCE
the above Ice Cap would have been diminishing quite rapidly until the pole
shift of 699/698 BCE, after which it would have continued to diminish at a
considerably slower rate. As you can see in the map above, the southern edge of
the land ice (commonly known as the ‘Ice Age’) is forming a half circle around
the point of said North Pole location near the Norwegian coast. No doubt there
would have been floating ice over most of the ocean within the other half of
said circle at that time. The above may be a fairly accurate map showing the
Ice Cap around the North Pole at the time of Joshua’s Long Day around 1420 BCE,
some 3,450 years ago. Interestingly, the narrator in the video is stating “It may have been a
single day that sealed its fate… [the fate of Doggerland]”
Atomic
Time vs. Solar Time
Documented
Decay of the Speed of Light
Causes
Decay
in the Ages Reported by Atomic Clocks
18
Billion Atomic Years = 6,000± Solar Years
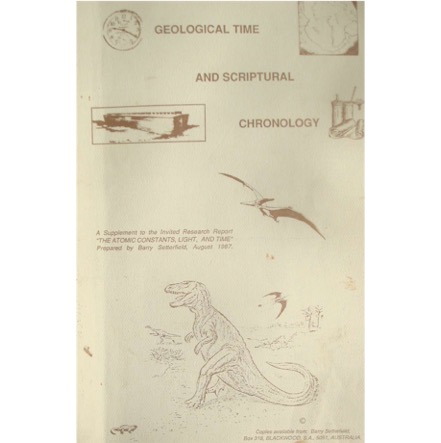
Fig. 50. Title page.
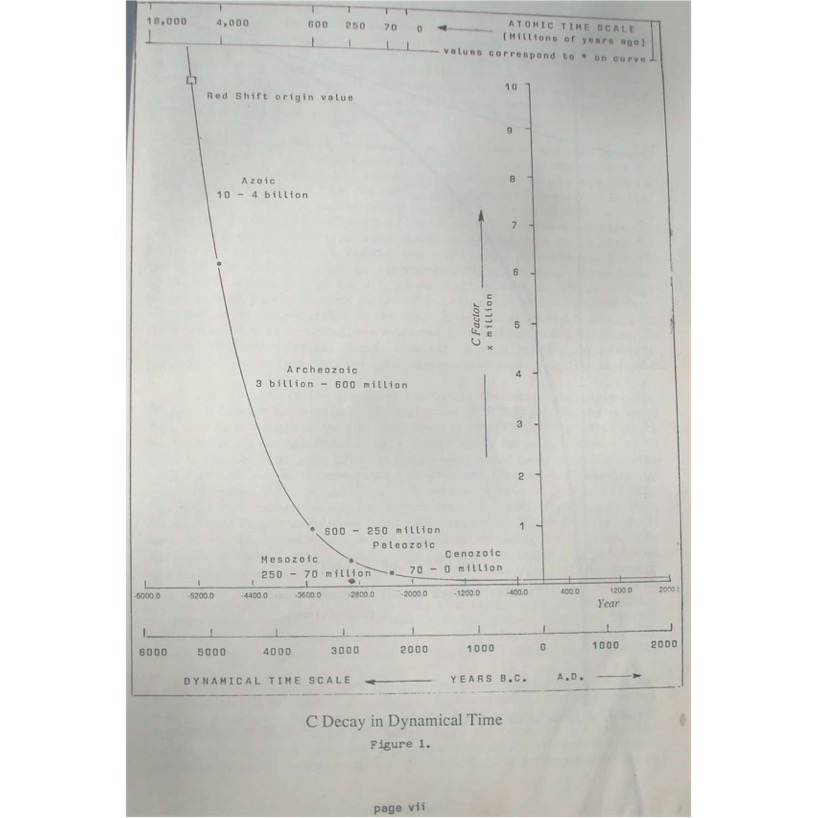
Fig. 51: Conversion
of Radioactive Decay years to Solar Years.
Notice in
particular that Noah’s Flood (c. 2345 BCE) corresponds to 70 million Atomic
years ago!
This is useful for
a better comprehension of the thousands and millions of years typically
referenced by such as are still being fooled by evolutionist teaching.
Please remember this
when looking at the BC dates provided in the “Ice Age” maps below!
This is based upon
the fact that c, the speed of light, has decayed over time, and is not
constant.
For more details,
please consider the research report below:
Fig. 52: Title page
of Stanford Research Report.

Fig. 53.
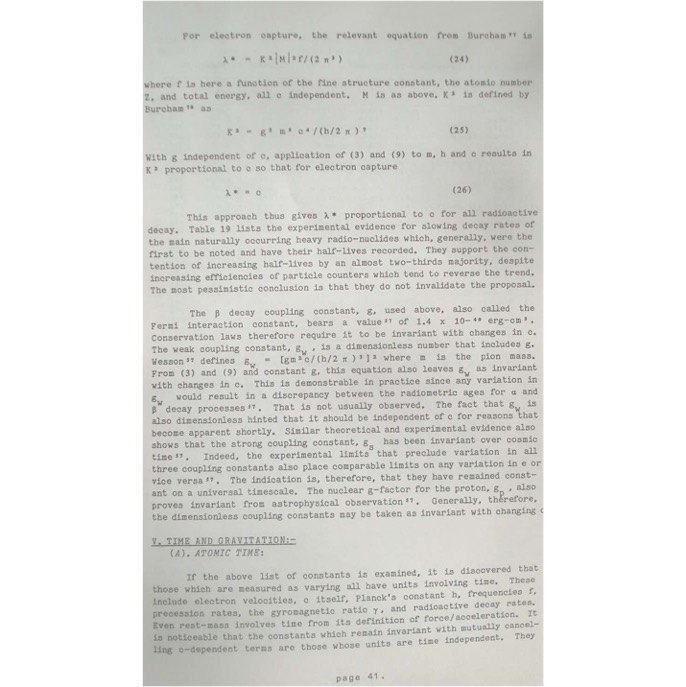
Fig. 54.
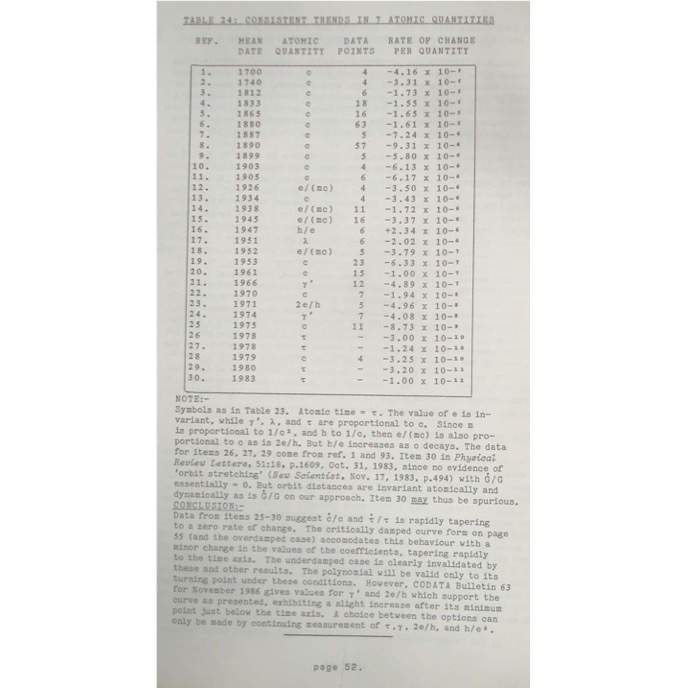
Fig. 55.
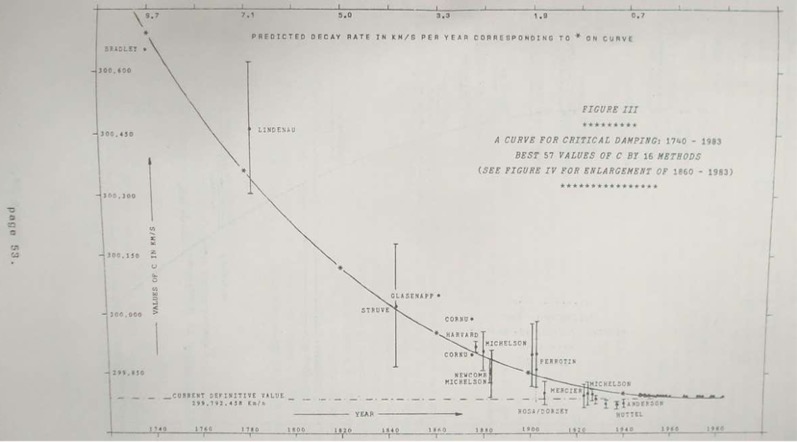
Fig. 56.

Fig. 57: The above
diagrams (Fig. 56 & 57) show how the measurements of the speed of light
have decreased since the earliest known measurements in 1700 CE.
It is important to
understand that the greater the speed of light, the shorter the half-life of
radioactive atomic particles. Thus the diagram in Figure 51 above!
The
Polar Ice Cap [of the Last Ice Age]
Rapidly
Melted Off Following the Long Day of Joshua in 1420± When
Scandinavia
Was Located Much Closer to the Equator
At Between 40 and 50 Degrees Latitude
Until
699/698 BCE When Scandinavia Moved to its Present Latitude:
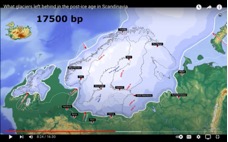
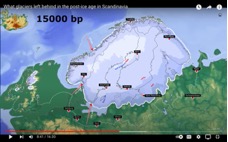
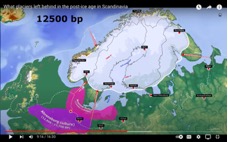
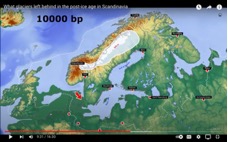
Below you may study various maps showing common
understanding of the last so called “Ice Age”, and the migrations-repopulations
following in the wake of the rapidly melting polar ice caps subsequent to said
ice cap trans locations to much warmer areas some 45 degrees closer to the
equator. For more detailed descriptions, please click the picture you are are
studying! Remember that the thousands of ‘bp’ years indicated on the pictures
below are based, not on solar years, but on atomic years, as referenced above!:
Figures 58 thru 91.
Fig. 92 & 93.
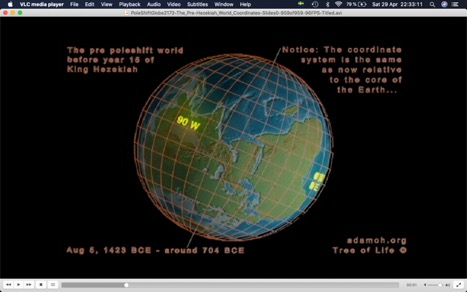
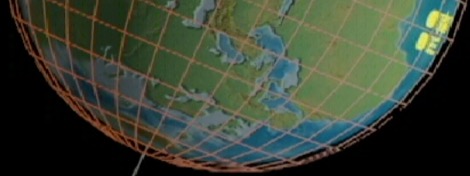
Showing the geographical coordinates applicable to the pre-Hezekiah pole shift.
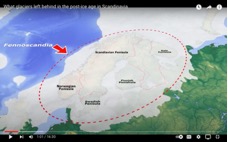
Notice in particular the location of Fennoscandia (Finland + Scandinavia) is
located between 40th and 47th latitude. That is, the last
prior location of the North Pole (≈70 miles outside of the Norwegian
coast line) has been transferred from 90° N to ≈50° S, or ≈40°
closer to the equator.
To
study my.3D Autocad animations.and analysis of past
Pole Shifts and prior polar cap locations, please enjoy this
link!
Re
the Dating of the Sphinx vs. the Recent Pole Shifts
Notice these words (from about
16:25-19:25 in the video) re the dating of the sphinx vs the above positioning
of Egypt from 1420± - 699/698 BCE! But 12°S± is well within the djungelbelt around the Equator, where
heavy rain-periods regularly occur!
[Re Antarctica vs.
Google Earth “pixeling”, i.e.
fudging the facts.]
[Re “the Younger
Dryas” as named from the
flower ‘Dryas octopetala’ that blooms in June and July at high elevations in polar regions of
the Earth]

Dryas Octapela.
Did these bloom at the time of the Pole Shift in the
year 699/698 BCE?
Did the last Pole
Shift take place in the autumn?
The
Melt Off of the Pre-1420± BCE Ice Cap
In
the Years Since 1420± BCE
Versus
Contemporary
Migrations
And
Viking Raids
Fig. 94 thru 101:
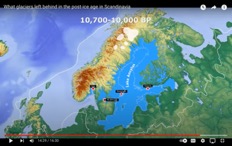
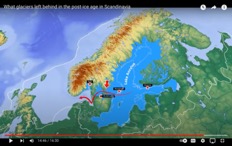
Notice in particular how that the coastlines, and the size and shape of the
Bothnic Sea, rapidly changed during the 700+ years between the 1420± BCE pole
shift and the 699/698 BCE pole shift! As reported in the video (between
fig. 94 and 95 above) “a cooler
climate…” slowed down the rate of ice cap melt off after the 699/698 BCE pole
shift when the South Pole moved from Hudson Bay, Canada to its present position
in the Arctic Sea, at which time Fennoscandia was alse moved closer to the pole
and placed between the 55th and the 70th latitude where
it currently remains. Nevertheless, during the next 3-4 centuries the remainder
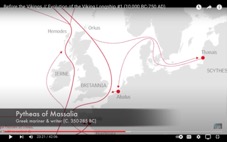
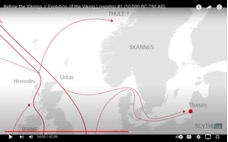
of the ice cap disappeared, such that in the 4th century BCE Pytheas
was able to sail freely between the North Sea and the Bothnic Sea (cf. fig. 107
thru 110 below!)
Although not shown
in the above maps, I would not exclude the possibility that at some point in
time there was also an outlet from the Bothnic Sea into one or both of the
Caspian Sea basin and/or the Black Sea basin. Be that as it may, Fennoscandia
was easily circum navigable through waters located well below the 50th
latitude until said 699/698 BCE pole shift!
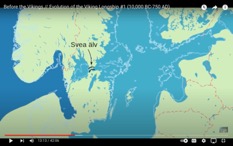
Fig. 102: Notice in
particular the green area of “Frequent Viking raids…” reaching from the Caspian
Sea and Black Sea basins all the way to the Arctic Sea, and from then onwards
along the Norwegian coast and into Fenoscandia. Seems to me like powerful
evidence of open water ways along all of those green areas of “Frequent Viking
raids…”!
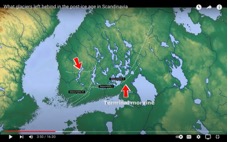
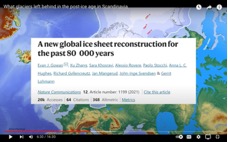
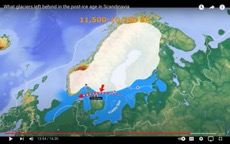
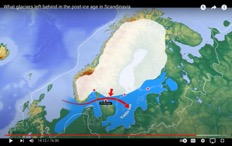
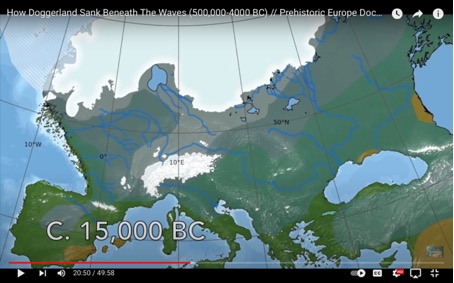
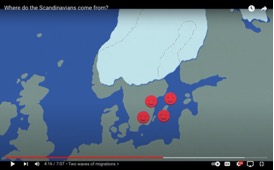
Fig. 103: Notice in
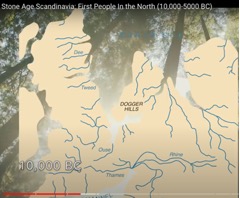
particular that the ice cap edge is draining through
the Volga river into the Black Sea
(i.e. from the right side of the ice cap in the map). Per the within Bible
based pole shift scenario, the above situation would correspond to the time of
Joshua, before or shortly following the 1420± BCE pole shift.
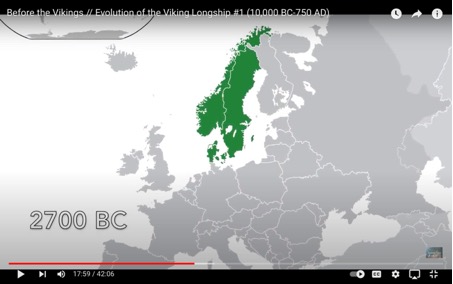
Fig. 104: “At the
time, Scandinavia’s climate may have been comparable to that of central
Germany…” [Listen for about 25 seconds to the embedded link!] Notice the atomic
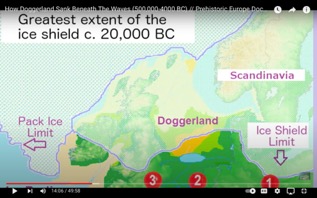
year date “2700 BC”! Please compare fig. 102 above
109 & 110 below, which maps must surely
represent the situation in the 4th century BCE (solar year time)
when Pytheas traveled those areas.
Fig. 105: Notice
the direction of the “amber route” from north to south!
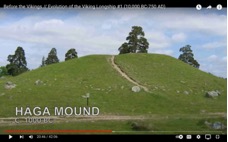
Fig. 106: Grave
mounds are found along the west, south, and east Swedish coast lines and around
lake Mälaren, but not much north of there. On the west and south coast those
contain remains from Eskimo cultures (“stone age people”), whereas on the east
coast and in Mälaren the people from the east are found, that is the “Bronze
Age” people.
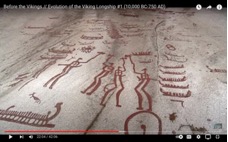
Fig. 107: These
type of rock engravings are found along the coasts of Sweden, and even along
the northernmost coastline of Norway! Powerful evidence of the water routes
being traveled in those days! That is, during the 700+ years between the pole
shifts of 1420± BCE and 699/698 BCE. I find it likely that the northernmost
areas would have rapidly diminished following the last said pole shift of
699/698 BCE.
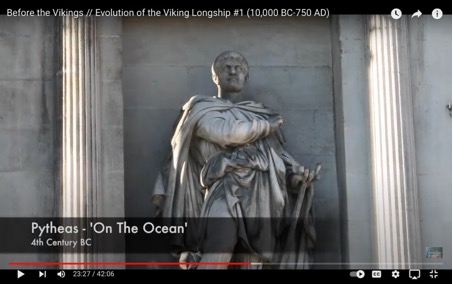
Fig. 108 thru 111:
As also referenced at the beginning of the book Swenska Historien (Fig. 4 &
5 above) Pytheas book ‘On The Ocean’ is lost,
leaving only fragmentary references to his 4th century BCE travels
(as mapped in figures 108 thru 110 above.
Cf. fig. 102 above!).
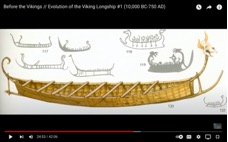
Fig. 112 thru 114:
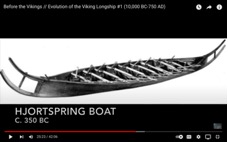
Did Pytheas travel in ships like these?
Fig. 115 thru 118.
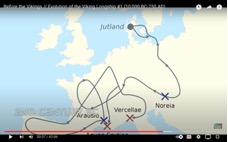
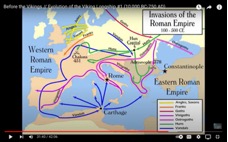
Notice the southbound migrations from Ferroscandia to southern Europe following
the last pole shift (699/698 BCE) as the Fennoscandia climate suddenly became
much colder. Apparently this southward migration continued through the first
few centuries CE, while people from the south migrated northward from the Roman
Empire.
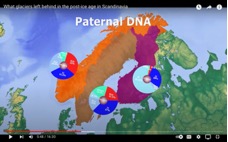
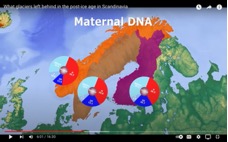
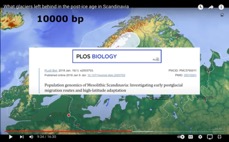
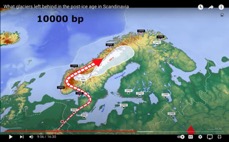
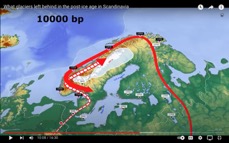
Fig.
119: Click the above photo to watch a 1-minute movie showing a DNA-based
correlation between migrations
into Scandinavia versus melt off of the polar ice cap. Based upon
the within Bible based pole shift scenario, said video should be more properly
timed beginning at 1400± BCE, i.e. 3,400 years ago,
not 9,000 years ago as stated in the video.
Two Consecutive,
Differently Distributed,
Polar Ice Caps / “Ice Ages”
Including Greenland Only
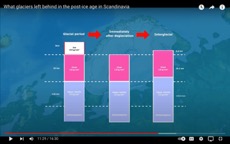
Fig. 120: Notice
the circular ice cap (including N. America and Greenland), as forming around
the Hudson Bay South Pole, while the Fennoscandia portion of the prior ice cap
is rapidly melting off. Thus leaving Greenland alone as part of two distinctly
separate, but consequtive, polar ice regions.
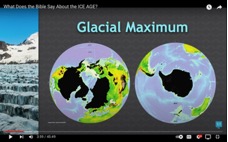
Fig. 121: This
shows the “Glacial Maximum” at both polar areas of our planet. Cf. fig. 119
above!
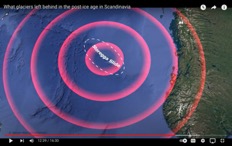
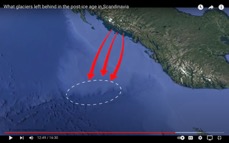
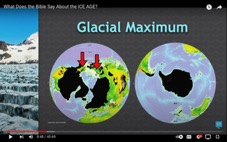
Fig. 122: Notice
the areas pointed out with the red arrows! The lecturer in the linked video
behind the above pictures has his own explanations for this phenomenon based
upon his “One Age Only” scenario (cf. fig. 127 below), but I would insist that
the within pole shift scenario is a much simpler and obvious explanation.
Fig. 123: Following
the 1420± BCE pole shift, the N. American ice cap began building up, while the
north European ice cap rapidly melted off during the 700+ years prior to the
699/698 BCE pole shift. Again notice please how Greenland remains within both
of said distinctly separate, but consequtive, polar ice caps.
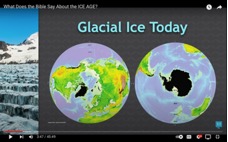
Fig. 124: For
comparison, “Global Ice Today”. That is, glaciers located on land.
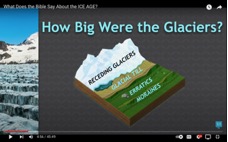
Fig. 125: “How Big Were
the Glaciers?” This pictures shows the land marks left behind at the edges of
previous glaciers. I would be interested in knowing more re wheter or not the
formations are different if left behind when the edge of the retreading glacier
is extending into the open sea, versus when this event occurs above the coast
line?
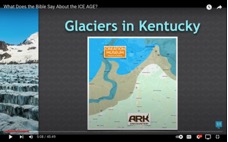
Fig. 126: “Glaciers
in Kentucky” shows one typical exampel of where land marks of maximum ice caps
are found. Cf. fig 125 above!
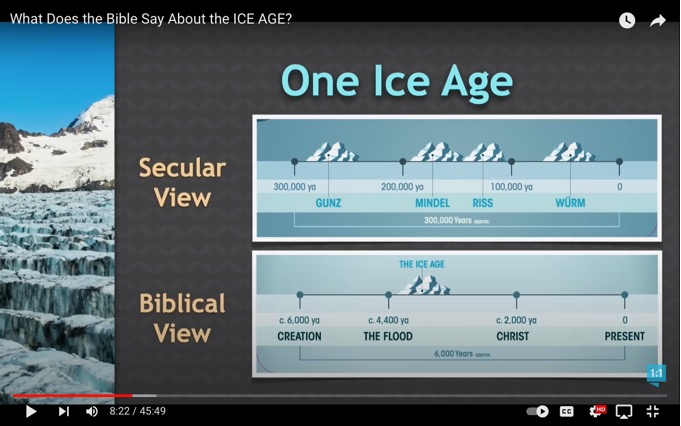
Fig. 127: A
comparison between common “Secular View” versus the “Biblical View” held by the
authors of th video behind the above picture. I would rather suggest a scenario
using the above “Biblical View” time frame, but with different ice cap
distributions for each of at least three different pole placements since Noah’s
Flood. Each new placement following a very rapid pole shift of about 150
degrees north to sount within little more than about 72 hours from start to
finish. This would certainly explain the extreme weather situations necessary
for almost instant freezing of the animals found in the permafront and in the
Alaskan muck. Cf. also fig. 130 and 131 below!
Fig. 128 thru 129:
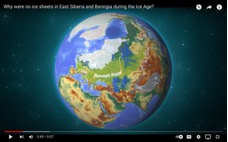
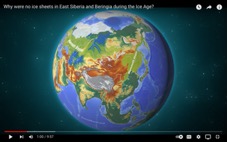
The ’Mammuth Steppe’. Cf. fig. 92-93
above!
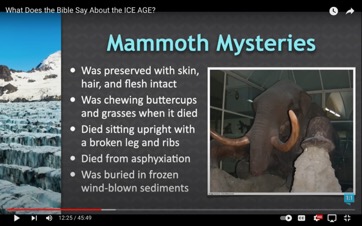
Fig. 130: I notice
in particular the words “Mammoth… Was chewing buttercups and grasses when it
died”. To me this is an obvious sign of the season when this sudden event
occurred. That is, this event happened during the summer season. Seeing that,
prior to last pole shift, the Siberian land area was located between latitude
20 S and latitude 40 S (cf. fig. 92-93
above!), said summer season would correspond to October 699 BCE thru
February 698 BCE. Presumably said “buttercups and grasses” have already been
identified in great detail, and getting access to that information should
facilitate a much more exact date and season for said event!
Fig. 131: Buttercups
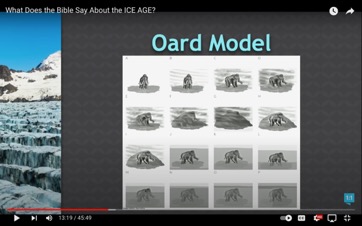
Fig. 132: The “Oard
Model” is a well supported model for a process such as the one that buried the
Mammoths in the permafrost so very quickly. Even more so when applying the
superextreme weather contidions associated with a 72 hour 150 degree Siberian
area move from latitude 30 ±10° S to the current latitude 70 ±5° N at the time
of the 699/698 BCE pole shift. Click the picture to listen to the lecturer’s
description of the event!
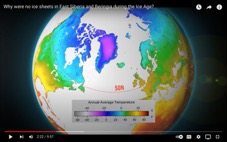
Fig. 133:
Current temperature
distribution
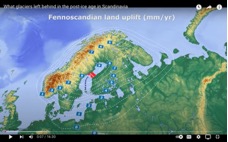
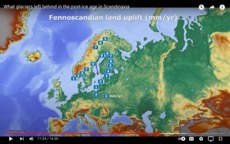
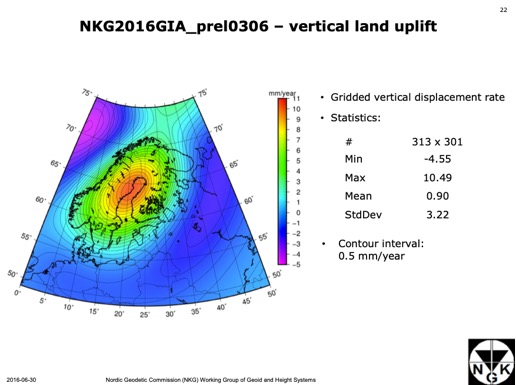
Fig. 134: The above map mirrors
the extent of the so-called Ice Age that covered northern Europe. That is, the
land ice covering the polar cap prior to the Pole Shift that took place around
1420 BCE. The enormous weight of said land ice depressed the Earth’s crust at
that time, most especially, all of the red area above, and extending from there
through the yellow, the green, and into the blue area within the above map.
That is, more forceful depression closer to the North Pole of pre-1420 BCE. As
the immense weight of said ice covering disappeared over the subsequent
centuries, the entire area that had previously been depressed was now lifted
up, like an empty soup dish floating upon the melted magma underneath. This
would initially have allowed the melting waters from those inland glaciers to
flow eastward towards the Black Sea and the Caspian Sea, which seas may even
have extended to and included, around 700 BCE, the present Bothnic Sea area.
Eventually however, as those ice masses disappeared, the crust of Earth
covering that entire area was slowly lifted up such that the blue areas in the
above map effectively dammed up the Bothnic Sea depression in the middle until
the predominant outlet of the Bothnic Sea was towards the west south west
direction, presently through Öresund between Denmark and Sweden. Given more time,
eventually only the red, yellow, and green areas in the above map continued to
rise, as they still do, thus diminishing the central lifting power and causing
the surrounding blue areas to slowly sink downwards again towards the initial
pre-ice, and pre-polar, non-depressed, flat land it once was.
Accordingly, the immigrant
Vikings from the East around 700 BCE may well have been able at that time to
travel by ship all the way back and forth between the present day Bothnic Sea
and the Black Sea. Then, gradually, as the ice disappeared and as the land
slowly rose up along the present-day watershed between the Bothnic Sea and the
Black Sea areas, and as the Vikings’ previously established travel routes
required from time to time, the Vikings adapted, by whatever means, to get
their ships across the resulting watershed-embankment between the Baltic Sea
basin and between the Black and Caspian Sea basins.
Notice, please, that said events
around 700 BCE were concurrent with the capture of the 10 tribes out of Israel,
and their displacement throughout the Assyrian kingdom. The Assyrian kingdom at
that time reportedly extended all the way to the headwaters of the river Volga,
which headwaters at that time, as we may recognize from the above said, were
likely extending to the Bothnic Sea! Re the bronze used extensively by those
eastern immigrants, please remember also the abundance of metals available
during the time of Solomon around 1000 BCE! 1 Kings 10:21; 2 Chronicles 9:20;
Ezra 8:27.
Somewhere [?] I remember reading
also that, at the time when Ansgar brought Catholic “Christendom” to Sweden (in
the 9th century CE), the “heathen” people inhabiting the deep woods
of Scandinavia were keeping the Seventh Day Sabbath. Apparently, their
conversion to ‘Christendom’ involved changing their Sabbath keeping habits from
the Seventh Day to the First Day [of the week.][1]
That is, in accord with the Sunday Laws introduced May 7, 538 CE by the 3rd
Council of Orléans, a synod of the Roman Catholic Bishops of France. [Cf. the
time line diagram within this
link!]
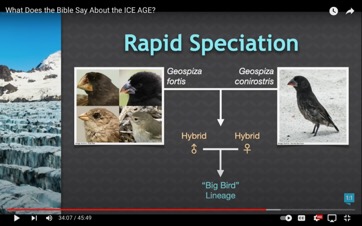
Fig. 135: Click the picture to listen to a
Creationist explanation of how new species may come into being! Most
interesting indeed! Valuable information!
Feel free to use, and for sharing freely with others, any of the truth
and blessings belonging to God alone. I retain all the copyrights to the
within, such that no one may lawfully restrain my use and my sharing of it with
others. Including also all the errors that remain. Please let only me know
about those. I need to know in order to correct them. Others don’t need to be
focused upon the errors that belong to me alone. Please respect that, and
please do not hesitate to let me know of any certain error that you find!
Without recourse.
All Rights Reserved. Tree of Life©


